In this analysis
Two correct queries, two different answers
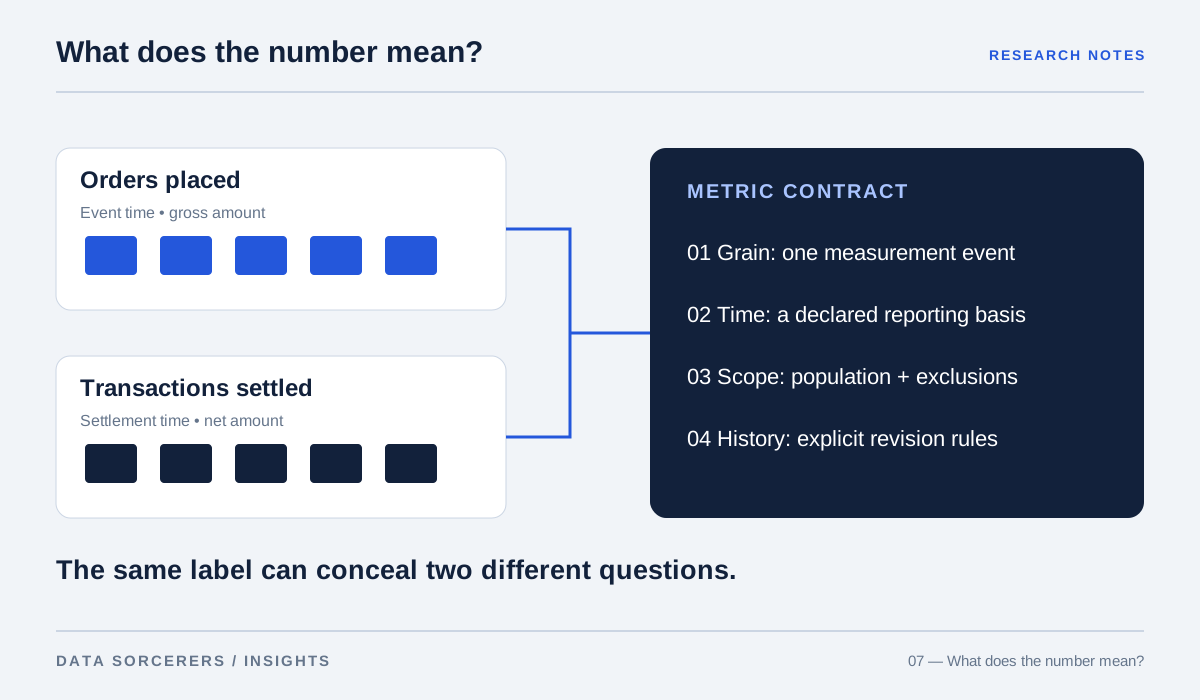
At a Monday meeting, finance reports one revenue figure while the commercial team presents another. Both analysts can reproduce their SQL. Neither has made an arithmetic mistake. One query counts orders when placed; the other recognizes completed transactions after refunds. The disagreement is about the event being measured. This hypothetical scene explains why adding another dashboard can leave an organization’s information problem untouched.
Codd’s relational model separates logical data relationships from aspects of physical storage, providing a foundation for structured querying. It does not decide what “revenue,” “active customer,” or “growth” should mean for a business. 1 Those definitions require explicit choices. A technically consistent database can support several coherent answers to questions that only appear identical.
Begin with the grain
Kimball’s discussion of fact tables emphasizes declaring the grain: what one row represents. 2 A row per order, order line, shipment, or refund supports different calculations. Joining them without respecting those differences can duplicate measures while leaving the output plausible.
Suppose an order contains three items and two shipments. A careless join can multiply an order-level amount across combinations of lines and shipments. The resulting chart may retain familiar trends, making the error difficult to spot visually. Our recommendation is to state the measurement event before writing the metric. Then test the aggregation against a small, manually understood example with multiple items, partial shipments, and refunds. A precise toy example can reveal a conceptual error that a large production total conceals.
The calendar is part of the metric
RFC 3339 defines an interoperable timestamp representation including offsets. It helps systems exchange times unambiguously, but a timestamp format alone does not establish a business reporting calendar. 9 A transaction near midnight can fall into different reporting days depending on the selected timezone and business rule.
The organization must choose whether a daily measure follows event time, ingestion time, or a later accounting event. Late-arriving records also need a policy: revise the earlier period or place an adjustment in the current one. Neither choice is universally correct. The important point is that readers should be able to understand which choice produced the number. Otherwise, a “final” monthly result can change without an intelligible explanation.
Missing is not the same as zero
PostgreSQL’s documentation distinguishes aggregate behavior such as counting rows versus counting non-null expressions. Its comparison rules also reflect SQL’s treatment of null as unknown rather than an ordinary value. 67 These details can become business semantics when a dashboard silently converts unknown values into zeros.
Imagine a customer-satisfaction average where some locations have not submitted responses. Reporting their score as zero says something different from reporting that no measurement exists. Excluding them changes the denominator. We recommend showing the population covered alongside the result when missingness materially affects interpretation. The definition should explain whether absent records indicate no activity, incomplete collection, or a state that the source system cannot represent.
History can be rewritten accidentally
Kimball’s work on slowly changing dimensions describes ways to preserve changes in descriptive attributes over time. Microsoft’s star-schema guidance explains the roles of fact and dimension tables in analytical models. 35 Together they help expose a common ambiguity: should a historical sale be attributed to the customer’s region at the time of sale or to the region assigned today?
A dashboard that joins every event to the latest customer profile may restate history when a territory changes. That can be appropriate for a current organizational view, but it is a different question from historical accountability. Publish both views when both are useful, with names that reveal the difference. A single unlabeled metric should not switch between them as implementation details evolve.
A semantic layer cannot settle a disagreement by itself
The dbt Semantic Layer centralizes metric definitions and their relationships to underlying models. 4 Such infrastructure can reduce duplicated logic, but it cannot decide which definition the organization should adopt. Centralizing a disputed calculation makes it consistently disputed.
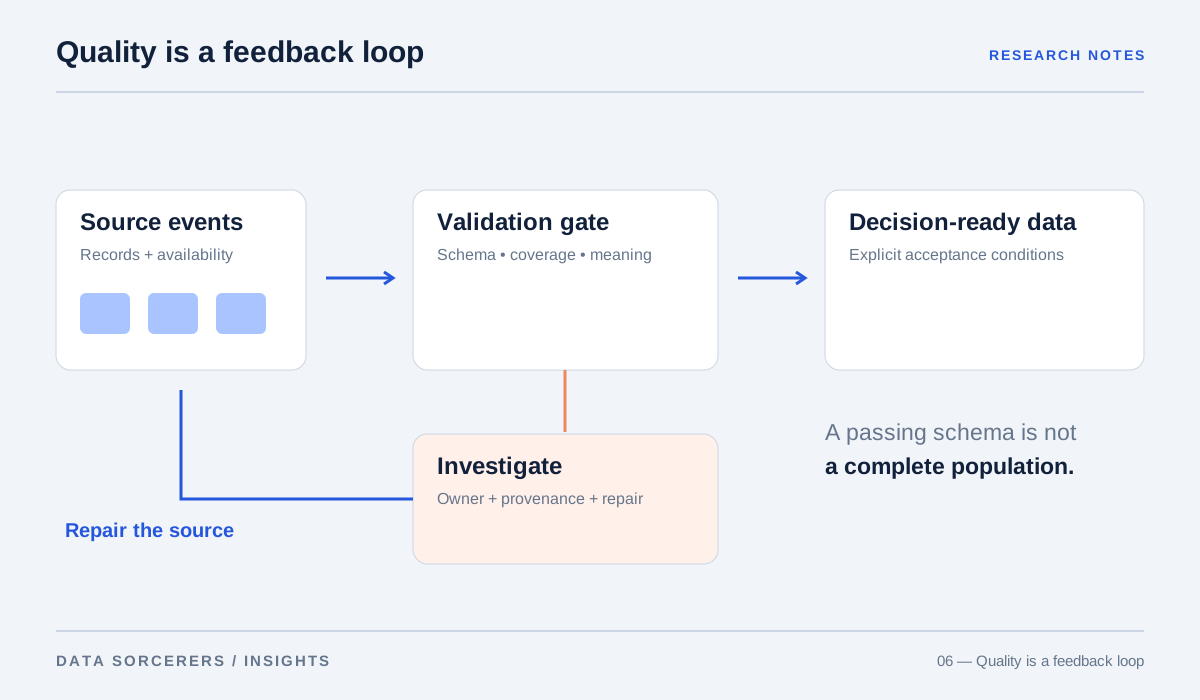
The governance work is to name an accountable owner, document exclusions and adjustment rules, and review changes with affected consumers. A useful metric contract includes its grain, population, time basis, formula, permitted dimensions, and revision policy. This is our proposed operating practice rather than a requirement imposed by the cited tool. The technical layer then implements a decision that people can explain.
Access changes what a reader can see
Microsoft’s row-level security guidance describes filtering data according to roles or identities. W3C PROV provides a model for recording how information is derived. 810 These are different mechanisms, but both matter when two people compare figures: one concerns the visible population, the other the transformation history.
A regional manager and a national analyst may see different totals because their access scopes differ. That is not necessarily an inconsistency. The interface should make scope legible without exposing restricted information. Likewise, a revised source extract should be traceable to the report version it produced. A trustworthy metric has an explanation for both what is included and why this particular reader is seeing it.
A join can change the unit without announcing it
Consider a hypothetical order worth 100 units of currency with two line items. Joining the order table to its lines produces two rows carrying the same order-level amount. Summing that amount now returns 200, even though no new sale occurred. The SQL engine has followed the query correctly; the aggregation has violated the intended grain.
The remedy is not a universal instruction to use DISTINCT, which can erase legitimately repeated values. Aggregate measures at their declared grain, choose relationships that preserve the intended population, and test joins with examples where multiplicity is known. Kimball’s fact-table guidance and Microsoft’s star-schema discussion provide the modeling context for these choices. 25 A metric review should therefore inspect the route from event to aggregate, not only the final formula. A correct arithmetic expression can still operate on the wrong set of rows.
The meeting becomes a better conversation
Before redesigning the dashboard, choose one contested metric and write its definition with the people who use it. Walk through edge cases using a small set of records. Agree on how revisions will be communicated, and preserve the previous definition when a change would alter historical comparisons.
The value of business intelligence is not that every team repeats the same number. Different operational questions can legitimately require different measures. The value is that those differences become explicit enough to support decisions. A mature reporting environment makes it possible to ask whether demand, fulfillment, collections, or margin changed without first spending the meeting discovering that the participants have been discussing different events.
Agree on the meaning of a metric before optimizing its chart.
Sources & methodology
This editorial synthesizes primary research, technical standards, and original engineering documentation. It is not an original experimental study or a systematic literature review. Research findings apply to the conditions studied; product recommendations are our interpretation. Figures explain concepts and do not present experimental measurements.
Sources checked on 31 October 2026. Publication dates and preprint versions may differ; the linked record identifies the referenced work. To suggest a correction, email contact@data-sorcerers.com.
- Codd (1970) — A Relational Model of Data for Large Shared Data Banks ↗Back to text ↑
- Kimball (2008) — Fact Tables ↗Back to text ↑
- Kimball (2008) — Slowly Changing Dimensions, Part 2 ↗Back to text ↑
- dbt Labs — dbt Semantic Layer ↗Back to text ↑
- Microsoft — Understand Star Schema and the Importance for Power BI ↗Back to text ↑
- PostgreSQL — Aggregate Functions ↗Back to text ↑
- PostgreSQL — Comparison Functions and Operators ↗Back to text ↑
- Microsoft — Row-level Security with Power BI ↗Back to text ↑
- IETF (2002) — RFC 3339: Date and Time on the Internet: Timestamps ↗Back to text ↑
- W3C (2013) — PROV-Overview ↗Back to text ↑