In this analysis
The future entered through the spreadsheet
A demand model looks excellent in a backtest. Its features include a promotion schedule, product availability, and a cleaned sales history. In deployment, some of those fields arrive late and the promotion calendar changes. The model has been tested with information that the operator would not have possessed at the moment of prediction. This hypothetical failure is temporal leakage: the evaluation quietly gives the forecaster part of the future.
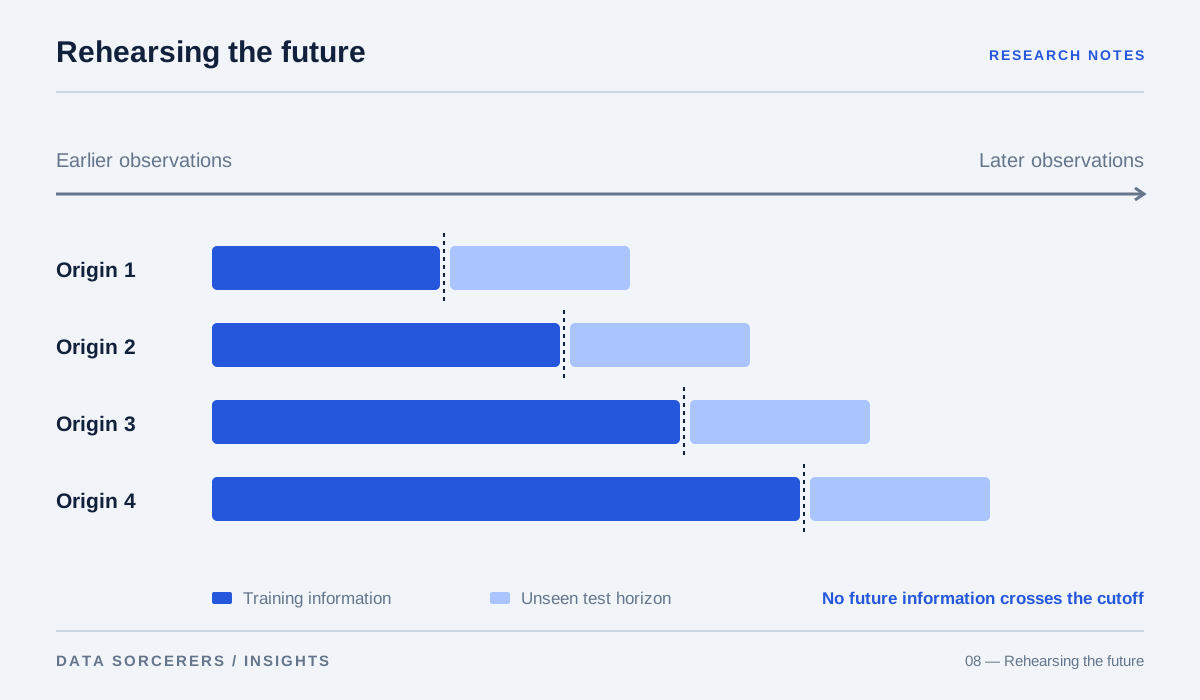
Kapoor and Narayanan examine leakage as a threat to reproducibility in ML-based science. Their analysis is broader than forecasting, but it clarifies why a sophisticated model cannot rescue an invalid evaluation design. 8 Before comparing algorithms, reconstruct the information set available at each forecast origin. The timestamp of an event and the time when that event became knowable may differ.
Make the experiment resemble the decision
Forecasting: Principles and Practice explains time-series evaluation, including rolling-origin approaches. Tashman’s review discusses out-of-sample testing choices such as origins and horizons. 14 These designs recognize that a forecast is made at a particular time for a particular future interval, not against a randomly selected record detached from chronology.
For a hypothetical retailer ordering stock four weeks ahead, evaluate four-week-ahead decisions using the data available when each order would have been placed. A model that excels at predicting tomorrow may not improve that ordering process. Preserve the retraining schedule and feature-release delays as well. The objective is to simulate the decision environment closely enough that the backtest can support a deployment argument.
Chronology matters, but slogans are not methodology
It is tempting to declare that cross-validation must never be used with time series. Bergmeir, Hyndman and Koo show why that claim is too broad: under specific conditions for purely autoregressive models, ordinary cross-validation can be valid. Those conditions do not automatically hold for every operational forecast. 2
The useful question is which dependencies and information assumptions a validation procedure preserves. Scikit-learn’s TimeSeriesSplit provides chronological splits and a configurable gap, but the tool cannot detect whether a feature was published after the prediction date. 9 Leakage checks still need domain knowledge. A chronological row split can coexist with a globally fitted transformation or a retrospectively corrected feature that exposes future information.
The baseline deserves a fair contest
The M4 competition compared many forecasting methods across a large collection of series. M5 examined a retail forecasting setting with its own hierarchy, evaluation design, and operational characteristics. 56 These competitions provide valuable empirical evidence, but a winning method in one competition is not a universal choice for every business.
Include simple seasonal and naive baselines appropriate to the task. Give every candidate the same information and evaluation horizon. If a complex model wins only after receiving features unavailable to the baseline at decision time, the comparison confounds modeling with information access. Report where gains occur: stable high-volume series, intermittent demand, new products, or periods of disruption may tell different stories.
The error measure chooses what matters
Hyndman and Koehler analyze limitations of forecast-accuracy measures and discuss scaled errors that support comparison. 3 A percentage error can behave poorly near zero, while an unscaled absolute error gives larger series more influence when aggregated. The metric is therefore part of the decision, not a neutral wrapper around it.
For an inventory workflow, underprediction and overprediction may have different consequences. A scientific evaluation can report standard errors while a separate operational analysis estimates those consequences under stated assumptions. Do not quietly replace one with the other. A model that reduces an aggregate error may still worsen stock availability in a small but important group of products. Show relevant slices and uncertainty around the comparison.
A distribution is more informative than a confident line
Gneiting and Raftery develop the theory of proper scoring rules, which reward honest probabilistic forecasts in expectation. 7 This matters because a point forecast alone cannot communicate the range of plausible outcomes. An interval drawn around a line is useful only if its construction and evaluation are understood.
In the retailer example, the ordering decision may depend on the upper part of the demand distribution rather than its mean. Evaluate probabilistic predictions with an appropriate scoring rule and inspect calibration over relevant periods. Do not imply that a historical interval-coverage result guarantees coverage during a new structural disruption. Uncertainty estimates also rely on assumptions and evidence that can become outdated.
An apparent win may not be a stable win
Diebold’s discussion of predictive-accuracy comparison cautions about the use and interpretation of forecast-comparison tests. 10 Statistical significance, practical importance, and robustness across operating conditions are different questions. Repeatedly searching among models and reporting the best result on the same test period can overstate the evidence.
Keep a final evaluation period separate from model selection where feasible. Examine performance across multiple forecast origins, and explain whether an advantage is concentrated in a few unusual events. If the gain is smaller than the operating cost of maintaining the model, the deployment case may remain weak. Conversely, a modest average gain may matter when it consistently improves a costly decision. The business interpretation should be explicit.
An interval changes the action, not just the chart
Two forecasts can have the same central estimate but very different uncertainty. In a hypothetical inventory decision, one predicts demand tightly around that estimate while another assigns meaningful probability to a shortage-producing surge. The preferred stock level may differ even though the line plotted on the dashboard is identical.
Proper scoring rules provide a principled way to assess probability distributions rather than only point estimates. 7 The operational decision then requires an explicit loss model: what does an extra unit cost, and what is the consequence of an unmet unit of demand? These are business assumptions, not properties inferred automatically by the forecasting model. Keep them visible and test sensitivity to plausible values. A probabilistic forecast helps only when its uncertainty reaches the decision process instead of being reduced to a decorative shaded band.
The forecast should survive contact with its user
A responsible deployment begins with an information-timing audit, realistic baselines, and a clear connection between horizon and action. Continue evaluating after release because assortment changes, new policies, and shifts in demand can alter the environment. Record overrides so that the team can distinguish model behavior from subsequent human decisions.
The research supports rigorous comparison rather than a promise that one method can anticipate every disruption. Our recommendation is to treat the backtest as a rehearsal of a future decision, including its inconvenient timing constraints. The strongest forecast is not the smoothest line in a presentation. It is one whose historical evaluation did not know more than its future operator will know, and whose uncertainty can be used in an actual decision.
Evaluate a forecast using the information that existed when the decision would have been made.
Sources & methodology
This editorial synthesizes primary research, technical standards, and original engineering documentation. It is not an original experimental study or a systematic literature review. Research findings apply to the conditions studied; product recommendations are our interpretation. Figures explain concepts and do not present experimental measurements.
Sources checked on 31 October 2026. Publication dates and preprint versions may differ; the linked record identifies the referenced work. To suggest a correction, email contact@data-sorcerers.com.
- Hyndman and Athanasopoulos — Forecasting: Principles and Practice, 3rd Edition ↗Back to text ↑
- Bergmeir, Hyndman and Koo (2018) — A Note on the Validity of Cross-validation for Evaluating Autoregressive Time Series Prediction ↗Back to text ↑
- Hyndman and Koehler (2006) — Another Look at Measures of Forecast Accuracy ↗Back to text ↑
- Tashman (2000) — Out-of-sample Tests of Forecasting Accuracy: An Analysis and Review ↗Back to text ↑
- Makridakis, Spiliotis and Assimakopoulos (2020) — The M4 Competition: 100,000 Time Series and 61 Forecasting Methods ↗Back to text ↑
- Makridakis et al. (2022) — M5 Accuracy Competition: Results, Findings, and Conclusions ↗Back to text ↑
- Gneiting and Raftery (2007) — Strictly Proper Scoring Rules, Prediction, and Estimation ↗Back to text ↑
- Kapoor and Narayanan (2023) — Leakage and the Reproducibility Crisis in ML-based Science ↗Back to text ↑
- scikit-learn — TimeSeriesSplit ↗Back to text ↑
- Diebold (2012) — Comparing Predictive Accuracy, Twenty Years Later: A Personal Perspective on the Use and Abuse of Diebold–Mariano Tests ↗Back to text ↑